
The $100M Draft Edge: A New Model for NBA Prospect ROI
- Dr. Sean Farrell

- Mar 19
- 7 min read
Last year at the MIT Sloan Sports Analytics Conference, I presented research showing how psycholinguistic signals from player interviews can help predict NBA outcomes.
Since then, I’ve been focused on a more practical question: How do you turn those signals into better draft decisions?
This focus has lead myself and my partners at Synaptiq to develop a new approach that allows us to move from asking:
“How good will this player be?”
to:
“What kind of bet is this player?”
Using this updated approach, we were able to pick that players like Danny Green, Dillon Brooks and Mario Chalmers were going to be much better players than their draft ranking would have suggested.
We also identified that players like Hasheem Thabeet and Markelle Fultz were unlikely to live up to their hype.
The value difference between the underpriced and overpriced prospects conservatively averages $100M+ across their respective careers. We propose that our approach could be used to unlock hidden value for NBA front offices.
The key shift
Our paper presented 3 models that combined psychology and performance features to successfully predict:
How likely a player is to make it onto an NBA team roster - a lightgbm classification model that essentially replicates the biases of NBA scouting departments
How many games a player is likely to play - a survival analysis model that predicts career longevity
How many games a player is likely to start in - a survival analysis model that predicts career impact
In this post I describe how we combine our model outputs into an easy to interpret tool that NBA teams can use to assess the balance between potential and risk.
Core vs Ceiling
Using our models for:
NBA entry probability
Career longevity
Starting impact
I built two measures which (at least for now) we are calling Most Valuable Prospect (MVP):
MVP Core → probability-weighted realized value (a combination of longevity OR impact)
MVP Ceiling → probability-weighted upside (a combination of longevity AND impact)

When plotting Core vs Ceiling (Fig 1) it is clear that players who play > 500 games and/or start in > 50% of their games tend to appear in the top right of the plot, where both the Core and Ceiling scores are highest.
However, there is also a clear separation where players who either don't make it into the NBA or don't play many games have higher Ceiling scores than their Core values. This looks to represent a valuable diagnostic tool.
Level vs Delta
To explore this separation further, we transformed the Core and Ceiling metrics into:
Level = (Core + Ceiling) / 2 → expected impact
Delta = Ceiling – Core → trajectory / variance
This creates a simple but powerful structure:
Level → expected NBA impact
Delta → development trajectory (upside vs stability)
The Level–Delta Map
Every prospect can now be placed in a 2D space that allows us to distinguish between fundamentally different player types that would otherwise be grouped together (I'm calling this the "crab claw" for now).

The divergence between players who don't make it vs those who go on to have high impact careers is now really clear!
Three archetypes
On this Level vs Delta plot we can clearly separate players into three separate groups:
Replacement Risk → low Level. Low probability of sustained NBA contribution
Rotation Value → stable, scalable contributors. High likelihood of becoming a reliable NBA role player (these players are often undervalued)
Impact Player → Combination of high baseline value + meaningful upside

Validation
We can also sort players who made it into the NBA into archetypes based on their performance:
Replacement Risk → play < 82 games
Rotation Value → play 82-500 games OR play 500+ games and start in < 33% of them
Impact Player → play > 500 games AND start in 33% or more of them
Comparing these performance based labels to those predicted via where they sit on the Level vs Delta plot we found we could:
Predict Impact Players with an accuracy of 73%, and
Predict Replacement Risk players with an accuracy of 82%.
Why this matters
This framework separates prospects by risk:
High-Delta, fragile upside
High-Level, low-variance contributors
True impact profiles
And that distinction shows up clearly when applied to past NBA drafts.
Sliding Doors Examples
Below I present some 'sliding door' scenarios, where players who we identified as likely Impact Players were drafted later than players we identified as likely 'Rotation Value' players. In each draft I (cherry) picked an alternate scenario that would have provided a better return on investment (ROI) for the team in question if they had instead selected the player identified by our approach.
ROI values were calculated using:
Player career win shares (WS), taken from Basketball Reference
An estimate of $2.38M USD per win share, taken from 538's analysis and adjusted to 2025 dollars
2006 NBA Draft

Early draft picks Shelden Williams (#5, Atlanta Hawks ), Rodney Carney (#16, Chicago Bulls), and Quincy Douby (#19, Sacramento Kings) all fall in the 'Rotation Value' zone
Later pick P.J. Tucker (#35, Toronto Raptors) falls in the 'Impact Player' zone
Taking Tucker at pick 19 over Douby would have produced a net ROI of $103M
2008 NBA Draft

Early draft picks Jerryd Bayless (#11, Indiana Pacers), Brandon Rush (#13, Portland Trail Blazers @ the Rose Quarter), and Anthony Randolph (#14, Golden State Warriors) all fall in the 'Rotation Value' zone
Later picks Courtney Lee (#22, Orlando Magic) and Mario Chalmers (#34, Minnesota Timberwolves) fall in the 'Impact Player' zone
Taking Lee at pick 14 over Randolph would have produced a net ROI of $80M
2009 NBA Draft

Early draft picks Hasheem Thabeet (#2, Memphis Grizzlies), and Jonny Flynn (#6, Minnesota Timberwolves) both fall in the 'Rotation Value' zone
Later pick Danny Green (#46, Cleveland Cavaliers) fell in the 'Impact Player' zone
Taking Green at pick 6 over Flynn would have produced a net ROI of $120M
2012 NBA Draft
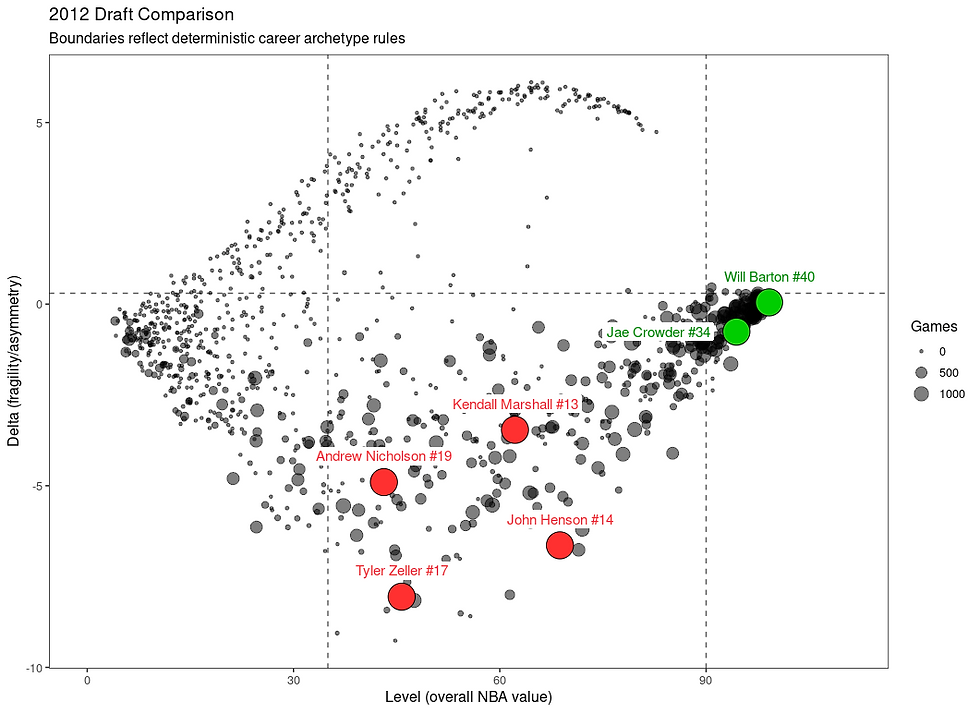
Early draft picks Kendall Marshall (#13, Phoenix Suns), John Henson (#14, Milwaukee Bucks Inc.), Tyler Zeller (#17, Dallas Mavericks), and Andrew Nicholson (#19, Orlando Magic) all fall in the 'Rotation Value' zone
Later picks Jae Crowder (#34, Cleveland Cavaliers) and Will Barton (#40, Minnesota Timberwolves) fall in the 'Impact Player' zone
Taking Crowder at pick 13 over Marshall would have produced a net ROI of $100M
2014 NBA Draft

Early draft picks Nik Stauskas (#8, Sacramento Kings) and Noah Vonleh (#9, Charlotte Hornets) both fall in the 'Rotation Value' zone, while Adreian Payne (#15, Atlanta Hawks) falls in the 'Replacement Risk' zone
Later pick Kyle Anderson (#30, San Antonio Spurs) falls in the 'Impact Player' zone
Taking Anderson at pick 15 over Payne would have produced a net ROI of $98M
2017 NBA Draft

Early draft picks Markelle Fultz (#1, Philadelphia 76ers) and D.J. Wilson (#17, Milwaukee Bucks Inc.) both fall in the 'Rotation Value' zone (although Fultz is very, very close to the 'Impact Player' zone)
Later picks Josh Hart (#30, Utah Jazz), and Dillon Brooks (#45, Houston Rockets) both fall in the 'Impact Player' zone, along with another early draft pick, Jayson Tatum (#3, Boston Celtics)
Taking Tatum at pick 1 over Fultz would have produced a net ROI of $137M
Even taking Hart at pick 17 over Wilson would have produced a net ROI gain of $92M
2019 NBA Draft

Early draft pick Romeo Langford (#14, Boston Celtics) just falls in the 'Rotation Value' zone
Later pick Keldon Johnson (#29, San Antonio Spurs) falls in the 'Impact Player' zone
Taking Johnson at pick 14 over Langford would have produced a net ROI of $48M
What These Examples Show
The model is not just predicting outcomes, it is:
Separating impact from variance
Identifying mispriced player archetypes
Quantifying decision risk
Why This Framework Matters
Draft decisions are inherently probabilistic.
The goal is not to eliminate uncertainty, but to:
price it correctly
separate types of uncertainty
align decisions with risk tolerance
The Level vs Delta framework provides a way to do that:
Level → expected return
Delta → variance / trajectory
Together, they define the shape of the bet.
Conclusion
The key shift in this work is moving from:
“How good will this player be?”
to:
“What kind of bet is this player?”
By separating impact and trajectory, and grounding both in data, we can make draft decisions that are:
More transparent
More consistent
More aligned with long-term value creation
Even the worst of the sliding doors scenarios described above would have represented a net ROI gain just in terms of win shares of ~$48M, with the highest ROI gain being ~$137M.
And this doesn't take into account other costs such as what the 6ers would have given up when they traded with the Celtics in 2017 to get the #1 draft pick.
Admittedly, these scenarios are heavily cherry picked, assume the drafted players would have stayed at that team for the duration of their careers, and don't count any gain those teams received in return for trading them further down the track (as the 6ers did with Fultz).
However, if even one of these alternate scenarios could be predicted as a better deal at the time of the draft, it could potentially net the team in question an enormous ROI gain.
At Synaptiq we will be running these models throughout the 2026 draft, and are already looking at the current front-runners. We are also actively working on producing similar models and metrics across other sports, so stay tuned!
Be sure to check out my paper (and my talk) which was the basketball track research paper finalist (and overall 3rd place winner) at the 2025 MIT Sloan Sports Analytics Conference.
